|
Expansion of Hong Kong International Airport into a Three-Runway System |
Contents
Executive Summary
The “Expansion of Hong Kong
International Airport into a Three-Runway System” (the Project) serves to meet
the future air traffic demands at Hong Kong International Airport (HKIA).
On 7 November 2014, the Environmental Impact Assessment (EIA) Report (Register
No.: AEIAR-185/2014) for the Project was approved and an Environmental Permit
(EP) (Permit No.: EP-489/2014) was issued for the construction and operation of
the Project.
Airport Authority Hong Kong (AAHK)
commissioned Mott MacDonald Hong Kong Limited (MMHK) to undertake the role of
Environmental Team (ET) for carrying out the Environmental Monitoring &
Audit (EM&A) works during the construction phase of the Project in
accordance with the Updated EM&A Manual (the Manual).
This is the 1st
Construction Phase Annual EM&A Report for the Project which summarizes the monitoring
results and audit findings of the EM&A programme during the reporting
period from 28 December 2015 to 31 December 2016, while the Section on Chinese
White Dolphin Monitoring summarizes the results between 18 December 2015 to 31
December 2016.
Key Activities in the Reporting
Period
Key activities of the Project
carried out in the reporting period were related to the following contracts:
Advanced
Works:
Contract
P560 (R) Aviation Fuel Pipeline Diversion Works
· Site preparation and establishment
works;
· Construction of temporary concrete
footing;
· Setup of site office;
·
Antenna
farm structural protection works;
·
Stockpiling
of excavated materials from Horizontal Directional Drilling (HDD) operation at stockpiling
area;
· Construction of containment pit at Sheung Sha Chau Island;
·
HDD work at launching
site and Sheung Sha Chau Island; and
Deep Cement Mixing (DCM) Works:
Contracts
3201 to 3205 DCM Works
·
Mobilization and
off-site plant fabrication;
·
Laying of geotextile
and sand blanket; and
·
DCM trial works.
Other
Works:
Contract 3213 CLP Cable Diversion Enabling
Works
· Installation of silt curtain;
· Excavation works and removal of
armour rock at the western part of the airport;
· Construction of drawpit;
and
· Installation of cable trough,
backfilling, and reinstatement of armour rock.
EM&A Activities Conducted in the Reporting Period
The EM&A programme was undertaken
in accordance with the Manual of the Project. A summary of the monitoring and
audit activities during this reporting period is presented as follows:
|
Monitoring/ Audit Activities |
Number of Sessions |
|
1-hour Total Suspended Particulates (TSP) Air Quality Monitoring |
411 |
|
Noise Monitoring |
265 |
|
Water Monitoring |
64 |
|
Ecological Monitoring |
6 |
|
Vessel line-transect surveys for Chinese White Dolphin (CWD) monitoring |
10 |
|
Land-based theodolite tracking survey effort for CWD monitoring |
25 |
Six month CWD baseline monitoring
was conducted between 18 December 2015 and 17 June 2016 and continued in July
2016 prior to the commencement of construction for marine works. Impact
monitoring was commenced on 1 August 2016, although there were no marine
construction activities in August and September 2016. A total of 5,619.7 km
survey effort was conducted for the vessel line transect survey during the
12-month monitoring period. A total of 208 groups of 785 CWD individuals
were sighted, with 46 groups of 181 CWDs recorded in northwest Lantau, 4 groups
of 16 CWDs in airport west, 96 groups of 347 CWDs in western Lantau and 62
groups of 241 CWDs in southwest Lantau. No CWDs were sighted in northeast
Lantau during the 12-month reporting period. The combined encounter rate by
number of dolphin sightings and by number of dolphins were 3.44 and 13.44
respectively. No exceedance of the encounter rates for Action and Limit Levels
were recorded during the construction phase. Average annual abundance of CWD in
Hong Kong western waters was estimated at 60 individuals in 2016 from
line-transect analysis. CWD relative occurrence from land-based surveys around
Lung Kwu Chau peaked in spring, concurrent with the
start of the wet season. Waters around Lung Kwu Chau
remain an important year-round habitat for CWD, especially for foraging.
Passive acoustic monitoring showed dolphins used the area around south of Sha
Chau throughout the year, but with increased activity during winter and spring
months. The acoustic data also showed consistently higher levels of
dolphin clicking activity at night, which may indicate increased using of
echolocation by dolphins during hours of darkness.
Ferry
movements between Hong Kong International Airport (HKIA) SkyPier
and Zhuhai / Macau were audited in the reporting period in accordance with the
Marine Travel Routes and Management Plan for High Speed Ferries of SkyPier (SkyPier Plan). In total,
10,043 ferry movements between HKIA SkyPier and
Zhuhai / Macau were audited in the reporting period. The daily movements of all
SkyPier High Speed Ferries (HSFs) in the reporting
period ranged between 1 and 97, which falls within the maximum daily cap number
of 125. There are fewer ferry movements on 1st, 2nd
August and 21st October 2016 due to
typhoon. The annual daily average of all the SkyPier
HSFs in 2016 was 91 movements, within the annual daily average cap of 99 SkyPier HSF movements. Most of the diverted HSFs had
travelled through the Speed Control Zone (SCZ) with average speeds within 15
knots, which complied with the SkyPier Plan.
Three cases of average speed deviation were due to public safety. All
ferry movements that did not strictly follow the diverted route were
investigated. Most of the deviation cases were related to strong tidal wave and
current, or giving way to other vessels due to safety and emergency situations.
The
audit of construction and associated vessels has started in August 2016 in
accordance with the Marine Travel Routes and Management Plan for Construction
and Associated Vessels (MTRMP-CAV). ET has conducted weekly audit to
ensure that the contractors were fully complied with the requirements of the MTRMP-CAV.
A total of 24 skipper training workshops were conducted by the ET from
August to December 2016 with captains of construction vessels associated with 3RS contracts. Another 18 skipper training workshops
were held by contractors’ Environmental Officers (EO) and competency tests had
been conducted subsequently with the trained captains by ET.
On
the implementation of the Marine Mammal Watching Plan, silt curtains were
deployed by the contractors for sand blanket laying works with dolphin
observers used in accordance with the Plan. On the implementation of the
Dolphin Exclusion Zone (DEZ) Plan, dolphin observers were deployed by the contractors for continuous
monitoring of DEZs for DCM trial works in accordance with the DEZ Plan. Trainings for the dolphin observers on the implementation
of MMWP and DEZ monitoring were provided by the ET prior to the aforementioned
works. Testing of night vision devices used for DEZ monitoring was also
conducted before the DCM trials. From contractors’ MMWP observation
records and DEZ monitoring records, no marine mammals
were observed within or around the DEZ and silt curtains during the reporting
period. Audits of acoustic decoupling for construction vessels were also
carried out by the ET.
Ecological
monitoring was undertaken monthly at the HDD daylighting location on Sheung Sha Chau Island in accordance with the Updated EM&A
Manual. During the reporting period, no encroachment into the egretry area at Sheung Sha Chau
by the HDD daylighting location or mooring of flat top barge was recorded.
Review of Environmental Quality
Performance Limits (Action and Limit levels)
During the reporting period, five
exceedance cases involving Action Level of 1-hour total suspended particulates
(TSP) monitoring were recorded during the reporting period. Investigations were
carried out immediately for each of the exceedance cases. The investigation
results indicated that the exceedances were not related to the Project.
There were, however, no exceedance cases involving Limit Level of 1-hour TSP
monitoring throughout the reporting period.
For water quality, the monitoring
results for dissolved oxygen (DO), total alkalinity, and chromium obtained
during the reporting period were in compliance with their corresponding Action
and/or Limit Levels stipulated in the EM&A programme for triggering the
relevant investigation and follow-up procedures under the programme if being
exceeded. For turbidity, suspended solids (SS) and nickel, some of the testing
results had exceeded the relevant Action or Limit Levels, and the corresponding
investigations were conducted accordingly. The investigation findings concluded
that all the exceedances were not due to the Project.
No breach of the Action or Limit
Levels in relation to noise, waste and CWD monitoring were recorded during the
reporting period.
Implementation Status and Review of Environmental Mitigation Measures
Weekly site audits were carried out during the reporting period to
confirm the implementation measures undertaken by the contractors.
Environmental issues related to the construction activities, including air
quality, noise, waste, CWD and ecology were monitored and/or reviewed.
The recommended environmental mitigation measures, as included in the
EM&A programme, were implemented properly in the reporting period. The
EM&A programme effectively monitored the construction activities and ensure
the proper implementation of mitigation measures.
Summary Findings of the EM&A
Programme
The following table summarizes the key findings of the EM&A
programme during the reporting period:
|
|
Yes |
No |
|
Details |
Analysis / Recommendation / Remedial Actions |
|
Breaches of Limit Level^ |
|
ü |
|
No exceedance of project-related limit level was recorded. |
Nil |
|
Breaches of Action Level^
|
|
ü |
|
No exceedance of project-related action level was recorded. |
Nil |
|
Complaints Received |
ü |
|
|
A complaint on night time work at Sheung Sha Chau was received on 29 Dec 2016. |
The complaint investigation was carried out in accordance with the Complaint Management Plan. The investigation detail is presented in S3.2.1. |
|
Notification of any summons and status of prosecutions |
|
ü |
|
No notifications of summons or prosecution were received. |
Nil |
|
Changes that affect the EM&A |
ü |
|
|
The Baseline Water Quality Monitoring Report was updated on 12 December 2016.
|
Nil |
Remarks: ^
only exceedance of Action/ Limit Level related to Project works will be
highlighted.
1
Introduction
1.1 Background
On 7 November 2014, the Environmental
Impact Assessment (EIA) Report (Register No.: AEIAR-185/2014) for the
“Expansion of Hong Kong International Airport into a Three-Runway System” (the
Project) was approved and an Environmental Permit (EP) (Permit No.:
EP-489/2014) was issued for the construction and operation of the Project.
Airport Authority Hong Kong (AAHK)
commissioned Mott MacDonald Hong Kong Limited (MMHK) to undertake the role of
Environmental Team (ET) for carrying out the Environmental Monitoring &
Audit (EM&A) works during the construction phase of the Project in
accordance with the Manual submitted under EP Condition 3.1. The Manual is
available on the Project’s dedicated website (accessible at: http://env.threerunwaysystem.com/en/index.html).
AECOM Asia Company Limited (AECOM) was employed by AAHK as the Independent
Environmental Checker (IEC) for the Project.
The Project covers the expansion of
the existing airport into a three-runway system (3RS) with key project
components comprising land formation of about 650 hectares and all associated
facilities and infrastructure including taxiways, aprons, aircraft stands, a
passenger concourse, an expanded Terminal 2, all related airside and landside
works and associated ancillary and supporting facilities. The existing
submarine aviation fuel pipelines and submarine power cables also require
diversion as part of the works.
Construction of the Project is to
proceed in the general order of diversion of the submarine aviation fuel
pipelines, diversion of the submarine power cables, land formation, and
construction of infrastructure, followed by construction of superstructures.
The updated overall phasing
programme of all construction works and contract description is presented in Appendix A.
1.2 Scope of this Report
This is the 1st
Construction Phase Annual EM&A Report for the Project which summarizes the
key findings of the EM&A programme during the reporting period from 28
December 2015 to 31 December 2016.
1.3 Project Organisation
The Project’s organisation structure
and the contact details of the key personnel are provided in Appendix B and Table 1.1 respectively.
Table 1.1:
Contact Information of Key Personnel
|
Party |
Position |
Name |
Telephone |
|
Project Manager’s Representative (Airport Authority Hong Kong) |
Principal Manager, Environment |
Lawrence Tsui |
2183 2734 |
|
Environmental Team (ET) (Mott MacDonald Hong Kong Limited) |
Environmental Team Leader |
Terence Kong |
2828 5919 |
|
|
Deputy Environmental Team Leader |
Heidi Yu |
2828 5704 |
|
|
Deputy Environmental Team Leader |
Keith Chau |
2972 1721 |
|
Independent Environmental Checker (IEC) (AECOM Asia Company Limited) |
Independent Environmental Checker |
Jackel Law |
3922 9376
|
|
|
Deputy Independent Environmental Checker |
Joanne Tsoi |
3922 9423 |
|
Advanced Works: |
|
|
|
|
Contract P560(R) Aviation Fuel Pipeline Diversion Works (Langfang Huayuan Mechanical and Electrical Engineering Co., Ltd.) |
Project Manager
|
Wei Shih
|
2117 0566
|
|
|
Environmental Officer |
Lyn Lau
|
5172 6543
|
|
DCM Works: |
|
|
|
|
Contract 3201 DCM (Package 1) (Penta-Ocean-China State-Dong-Ah Joint Venture) |
Project Director
|
Tsugunari Suzuki
|
9178 9689 |
|
|
Environmental Officer
|
Kanny Cho
|
9019 1962 |
|
Contract 3202 DCM (Package 2) (Samsung-BuildKing Joint Venture) |
Project Manager
|
Ilkwon Nam
|
9643 3117 |
|
|
Environmental Officer
|
Dickson Mak
|
9525 8408 |
|
Contract 3203 DCM (Package 3) (Sambo E&C Co., Ltd.) |
Project Manager
|
Seong Jae Park
|
9683 8693 |
|
|
Environmental Officer
|
Calvin Leung
|
9203 5820 |
|
Contract 3204 DCM (Package 4) (CRBC-SAMBO Joint Venture) |
Project Manager
|
Kyung-Sik Yoo
|
9683 8697
|
|
|
Environmental Officer
|
David Man |
6421 3238 |
|
Contract 3205 DCM (Package 5) (Bachy Soletanche - Sambo Joint Venture) |
Deputy Project Director |
Min Park |
9683 0765 |
|
|
Environmental Officer
|
Margaret Chung |
9130 3696 |
|
Reclamation Works: |
|
|
|
|
Contract 3206 (ZHEC-CCCC-CDC Joint Venture) |
Project Manager |
Kim Chuan Lim |
3693 2288 |
|
|
Environmental Officer
|
Kwai Fung Wong
|
3693 2252 |
|
Other Works: |
|
|
|
|
Contract 3213 CLP Cable Diversion Enabling Works (Wing Hing Construction Company)
|
Project Manager
|
Michael Kan |
9206 0550 |
|
|
Environmental Officer
|
Ivy Tam |
2151 2090 |
1.4 Contact information for the Project
The contact
information for the Project is provided in Table 1.2. The public can
contact us through the following channels if they have any queries and comments
on the environmental monitoring data and project related information.
Table 1.2:
Contact Information of the Project
|
Channels |
Contact Information |
|
Hotline |
3908 0354 |
|
|
|
|
Fax |
3747 6050 |
|
Postal Address |
Airport Authority Hong Kong HKIA Tower 1 Sky Plaza Road Hong Kong International Airport Lantau Hong Kong Attn: Environmental Team Leader Mr Terence Kong c/o Mr Lawrence Tsui (TRD) |
1.5 Summary of Construction Works
The key activities of the Project carried out
in the reporting period included five DCM contracts, an advanced works
contract, and a CLP cable diversion enabling work contract. The DCM
contracts involved DCM trials, laying of geotextile and sand blanket; the
advanced works contract involved the HDD works and construction of containment
pit; and the CLP cable diversion enabling work contract involved construction
of concrete cable trough below the surface of the existing seawall.
The locations of the works areas are
presented in Figure 1.1 to Figure 1.2. Some site
investigation works were carried out during the reporting period.
1.6 Summary of EM&A Programme
Requirements
The status for all environmental
aspects is presented in Table
1.3.
Table 1.3:
Summary of status for all environmental aspects under the Manual
|
Parameters |
|
|
Status |
|
|
Air Quality |
|
|
|
|
|
Baseline Monitoring |
At least 14 consecutive days before commencement of construction work |
|
The baseline air quality monitoring result has been reported in Baseline Monitoring Report and submitted to EPD under EP Condition 3.4. |
|
|
Impact Monitoring |
At least 3 times every 6 days |
|
On-going since its commencement in December 2015. |
|
|
Noise |
|
|
|
|
|
Baseline Monitoring |
Daily for a period of at least two weeks prior to the commencement of construction works |
|
The baseline noise monitoring result has been reported in Baseline Monitoring Report and submitted to EPD under EP Condition 3.4. |
|
|
Impact Monitoring |
Weekly |
|
On-going since its commencement in December 2015. |
|
|
Water Quality |
|
|
|
|
|
General Baseline Water Quality Monitoring for reclamation, water jetting and field joint works |
Three days per week, at mid-flood and mid-ebb tides, for at least four weeks prior to the commencement of marine works. |
|
The baseline water quality monitoring result has been reported in Baseline Water Quality Monitoring Report and submitted to EPD under EP Condition 3.4. |
|
|
General Impact Water Quality Monitoring for reclamation, water jetting and field joint works |
Three days per week, at mid-flood and mid-ebb tides. |
|
On-going since its commencement in August 2016. |
|
|
Initial Intensive Deep Cement Mixing (DCM) Water Quality Monitoring |
At least four weeks |
|
To be commenced according to the Detailed Plan on Deep Cement Mixing. |
|
|
Early/ Regular DCM Water Quality Monitoring |
Three times per week until completion of DCM works. |
|
On-going since its commencement in August 2016. |
|
|
Waste Management |
|
|
|
|
|
Waste Monitoring |
At least weekly |
|
On-going since its commencement in December 2015. |
|
|
Land Contamination |
|
|
|
|
|
Supplementary Contamination Assessment Plan (CAP) |
At least 3 months before commencement of any soil remediation works. |
|
To be submitted with the relevant construction works. |
|
|
Contamination Assessment Report (CAR) for Golf Course |
CAR to be submitted for golf course first; programme for submission of supplementary CAR at the other areas to be agreed. |
|
The CAR for Golf Course was submitted to EPD. |
|
|
Terrestrial Ecology |
|
|
|
|
|
Egretry Survey Plan |
Once per month in the breeding season between April and July, prior to the commencement of HDD drilling works. |
|
The revised Egretry Survey Plan was submitted and approved by EPD under EP Condition 2.14. |
|
|
Ecological Monitoring |
Monthly monitoring during the HDD construction works period from August to March. |
|
On-going since its commencement in March 2016. |
|
|
Marine Ecology |
|
|
|
|
|
Pre-Construction Phase Coral Dive Survey |
Prior to marine construction works |
|
The Coral Translocation Plan was submitted and approved by EPD under EP Condition 2.12. |
|
|
Coral Translocation |
- |
|
Carried out in accordance with the Coral Translocation Plan. |
|
|
Chinese White Dolphins (CWD) |
|
|
||
|
Baseline Monitoring |
6 months of baseline surveys before the commencement of land formation related construction works. Vessel surveys: Two full surveys per month; Land-based theodolite tracking: Two days per month at the Sha Chau station and two days per month at the Lung Kwu Chau Station; and Passive Acoustic Monitoring (PAM): For the whole duration of baseline period. |
|
Baseline CWD results were reported in the CWD Baseline Monitoring Report and submitted to EPD in accordance with EP Condition 3.4. |
|
|
Impact Monitoring |
Vessel surveys: Two full surveys per month; Land-based theodolite tracking: One day per month at the Sha Chau station and one day per month at the Lung Kwu Chau Station; and PAM: For the whole duration for land formation related construction works. |
|
On-going since its commencement in August 2016. Land-based theodolite tracking: In addition to the frequency as stipulated in the Manual, supplemental theodolite tracking is ongoing during the initial implementation period for the SkyPier Plan, i.e. in total twice per month at the Sha Chau station and three times per month at the Lung Kwu Chau station |
|
|
Landscape and Visual |
|
|
|
|
|
Baseline Monitoring |
One-off survey within the Project site boundary prior to commencement of any construction works |
|
The baseline landscape & visual monitoring result has been reported in Baseline Monitoring Report and submitted to EPD under EP Condition 3.4. |
|
|
Impact Monitoring |
Weekly |
|
On-going since its commencement in December 2015. |
|
|
Environmental Auditing |
|
|
|
|
|
Regular site inspection |
Weekly |
|
On-going since its commencement in December 2015. |
|
|
Marine Mammal Watching Plan (MMWP) implementation measures |
Monitor and check |
|
On-going since its commencement in November 2016. |
|
|
Dolphin Exclusion Zone Plan (DEZP) implementation measures |
Monitor and check |
|
On-going since its commencement in December 2016. |
|
|
SkyPier High Speed Ferries (HSF) implementation measures |
Monitor and check |
|
On-going since its commencement in December 2015. |
|
|
Construction and Associated Vessels Implementation measures |
Monitor and check |
|
On-going since its commencement in August 2016. |
|
|
Complaint Hotline and Email channel |
Construction phase |
|
On-going since its commencement in December 2015. |
|
|
Environmental Log Book |
Construction phase |
|
On-going since its commencement in December 2015. |
|
Taking into account the construction works in the reporting period,
impact monitoring of air quality, noise, water quality, waste management,
ecology and CWD were carried out in the reporting period.
The EM&A programme also involved
weekly site inspections and related auditing conducted by the ET for checking
the implementation of the required environmental mitigation measures as recommended
in the approved EIA Report. In order to enhance environmental awareness and
closely monitor the environmental performance of the contractors, environmental
briefings and regular environmental management meetings were conducted.
The EM&A programme has been
undertaken in accordance with the recommendations presented in the approved EIA
Report and the Manual. A summary of implementation status of the environmental
mitigation measures for the construction phase of the Project during the
reporting period is provided in Appendix C.
2
Environmental Monitoring and Auditing
2.1 Air Quality Monitoring
Impact 1-hour Total Suspended
Particulates (TSP) monitoring was conducted three times every 6 days at two
representative monitoring stations during the reporting period. The
locations of monitoring stations are described in Table 2.1 and presented in Figure 2.1. The Action and Limit Levels of the air quality monitoring stipulated
in the EM&A programme for triggering the relevant investigation and
follow-up procedures under the programme are provided in Table 2.1.
Table
2.1: Impact Air Quality
Monitoring Stations
|
Monitoring Station |
Location |
Action Level (mg/m3) |
Limit Level (mg/m3) |
|
AR1A |
Man Tung Road Park |
306 |
500 |
|
AR2 |
Village House at Tin Sum |
298 |
The graphical plots of impact air
quality monitoring results during the reporting period are presented in Graph
1.
Graph 1: Graphical Plot of 1-hour
TSP concentration at AR1A and AR2 during the Reporting Period
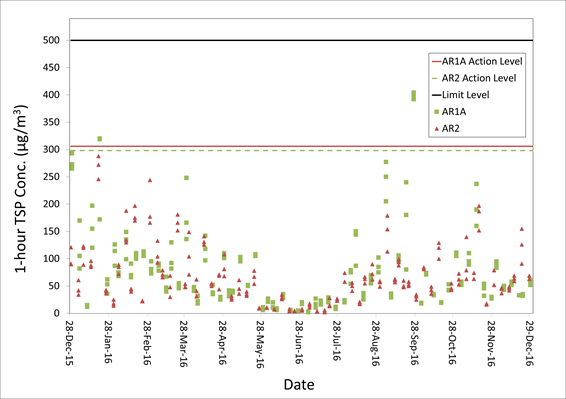
Two Action
Level exceedances of 1-hour TSP monitoring started at 10:00 and 11:00 were
recorded at AR1A on 21 January 2016. Actions were taken accordingly based on
the established Event and Action Plan as presented in the Manual. IEC and AAHK
were informed of the exceedances. It was confirmed that no major dusty
construction activities were conducted by contract P560(R), the major land
works, when the exceedances were measured. It is thus considered that the
exceedances were not related to the Project.
Another three Action Level
exceedances of 1-hour TSP monitoring started at 08:52, 09:52 and 10:52 were
recorded at AR1A on 27 September 2016. Actions were taken accordingly based on
the established Event and Action Plan as presented in the Manual. IEC and AAHK
were informed of the exceedances.
According to on-site observation by monitoring team, hazy weather was observed
during monitoring. It was confirmed that no major dusty construction activities were
conducted by P560(R) contractor when the exceedances were measured. The exceedances of 1-hr TSP might possibly be
due to the changes in the background air quality level and not project-related.
No exceedance of the Action and
Limit Level was recorded at AR2 in the reporting period.
The weather varied from fine to rainy
in the reporting period. Wind direction was mainly northeast or northwest
in the reporting period.
The key activities of the Project
carried out in the reporting period can be referred to Section 1.5 of this
report. Those works were not likely to cause adverse dust pollution.
The active construction site is
around 3 kilometres away from the nearest air sensitive receiver in Tung Chung.
The major dust sources during the reporting period were observed to be local
air pollution and nearby traffic emissions. It is considered that the
monitoring work in the reporting period was effective and there was no adverse
impact attributable to the works of the Project.
2.2 Noise Monitoring
Impact noise
monitoring was conducted at five representative monitoring stations once per
week during 0700 and 1900 during the reporting period. The locations of
monitoring stations are described in Table 2.2 and presented in Figure 2.1. The Action and Limit levels of the noise monitoring stipulated in the
EM&A programme for triggering the relevant investigation and follow-up
procedures under the programme are provided in Table 2.2.
The graphical plot of impact noise
quality monitoring results during the reporting period are presented in Graph
2.
Table 2.2:
Impact Noise Quality Monitoring Stations
|
Monitoring Station |
Location |
Action Level |
Limit Level |
|
NM1A |
Man Tung Road Park |
When one documented complaint is received from any one of the sensitive receivers |
75 dB(A) |
|
NM3A |
Site Office |
75 dB(A) |
|
|
NM4(i) |
Ching Chung Hau Po Woon Primary School |
65dB(A) / 70 dB(A) |
|
|
NM5 |
Village House in Tin Sum |
75 dB(A) |
|
|
NM6 |
House No. 1, Sha Lo Wan |
75 dB(A) |
|
|
Note: (i) reduce to 70dB(A) for school and 65dB(A) during school examination periods. |
|||
Graph 2: Graphical Plot of Leq (30 min) at NM1A, NM3A, NM4,
NM5, and NM6 during the Reporting Period
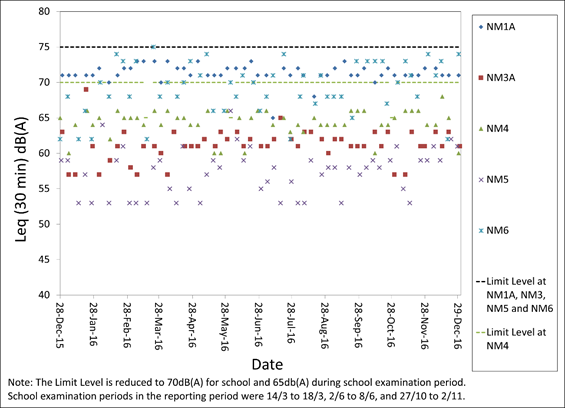
No
exceedance of the Action and Limit Level was recorded at all monitoring
stations in the reporting period.
The key activities undertaken in the
reporting period were not likely to cause adverse noise impact. The active construction work is around 900 metres away from
the nearest noise sensitive receivers in the villages in North Lantau. The major noise sources during the reporting period were observed to be
aircraft noise at NM3A and NM5, aircraft noise and helicopter noise at NM6,
road traffic noise at NM1A, and school activities at NM4 in the background. It is considered that the monitoring work in the
reporting period was effective and there was no adverse impact attributable to
the works of the Project.
2.3 Water Quality Monitoring
Water quality monitoring commenced in August 2016, although there were
no marine construction works in August and September 2016. Water quality
monitoring was conducted at a total of 22 water quality monitoring stations,
comprising 12 impact stations, seven sensitive receiver stations, and three
control stations in the vicinity of the water quality sensitive receivers
around the airport island in accordance with the Manual. Table 2.3 describes the details of the
monitoring stations. Figure 2.2 shows the locations of the monitoring stations.
Table 2.3:
Monitoring Locations and Parameters for Impact Water Quality Monitoring
|
Monitoring Stations |
|
Coordinates |
|
|
|
Description |
Easting |
Northing |
Parameters |
|
|
C1 |
Control |
804247 |
815620 |
|
|
C2 |
Control |
806945 |
825682 |
|
|
C3(3) |
Control |
817803 |
822109 |
|
|
IM1 |
Impact |
806458 |
818351 |
DO, pH, Temperature, Salinity, Turbidity, SS, Total Alkalinity, Heavy Metals(2) |
|
IM2 |
Impact |
806193 |
818852 |
|
|
IM3 |
Impact |
806019 |
819411 |
|
|
IM4 |
Impact |
805039 |
819570 |
|
|
IM5 |
Impact |
804924 |
820564 |
|
|
IM6 |
Impact |
805828 |
821060 |
|
|
IM7 |
Impact |
806835 |
821349 |
|
|
IM8 |
Impact |
807838 |
821695 |
|
|
IM9 |
Impact |
808811 |
822094 |
|
|
IM10 |
Impact |
809838 |
822240 |
|
|
IM11 |
Impact |
810545 |
821501 |
|
|
IM12 |
Impact |
811519 |
821162 |
|
|
SR1(1) |
Future Hong Kong-Zhuhai-Macao Bridge Hong Kong Boundary Crossing Facilities (HKBCF) Seawater Intake for cooling |
812586 |
820069 |
DO, pH, Temperature, Salinity, Turbidity, SS
|
|
SR2(3) |
Planned marine park / hard corals at The Brothers / Tai Mo To |
814166 |
821463 |
|
|
SR3 |
Sha Chau and Lung Kwu Chau Marine Park / fishing and spawning grounds in North Lantau |
807571 |
822147 |
|
|
SR4A |
Sha Lo Wan |
807810 |
817189 |
|
|
SR5A |
San Tau Beach SSSI |
810696 |
816593 |
|
|
SR6 |
Tai Ho Bay, Near Tai Ho Stream SSSI |
814663 |
817899 |
|
|
SR7 |
Ma Wan Fish Culture Zone (FCZ) |
823742 |
823636 |
|
|
SR8 |
Seawater Intake for cooling at Hong Kong International Airport (East) |
811593 |
820417 |
|
Notes:
(1) The
seawater intakes of SR1 for the future HKBCF are not yet in operation, the
future permanent location for SR1
during
impact monitoring is subject to finalisation after the HKBCF seawater is
commissioned.
(2) Details of selection criteria for the two heavy metals for
early regular DCM monitoring refer to the Detailed Plan on Deep Cement Mixing
available on the dedicated 3RS website http://env.threerunwaysystem.com/en/ep-submissions.html). DCM specific water quality monitoring parameters (total alkalinity
and heavy metals) were only conducted at C1 to C3, SR2, and IM1 to IM12
(3) According to the baseline water quality
monitoring report, C3 station is not adequately representative as a control
station of impact/ SR stations
during the flood tide. The control reference has been changed from C3 to SR2
from 1 September 2016 onwards.
2.3.1 Action and Limit Levels for Water
Quality Monitoring
The Action and
Limit Levels for general water quality monitoring and regular DCM monitoring
stipulated in the EM&A programme for triggering the relevant investigation
and follow-up procedures under the programme are presented in Table 2.4. The control and impact stations during flood
tide and ebb tide for general water quality monitoring and regular DCM
monitoring are presented in Table 2.5.
Table 2.4: Action and Limit Levels
for General Water Quality Monitoring and Regular DCM Monitoring
|
Parameters |
Action Level (AL) |
Limit Level (LL) |
||
|
Action and Limit Levels for general water quality monitoring and regular DCM monitoring (excluding SR1& SR8) |
||||
|
DO in mg/L (Surface, Middle & Bottom) |
Surface and Middle 4.5 mg/L |
Surface and Middle 4.1 mg/L 5 mg/L for Fish Culture Zone (SR7) only |
||
|
Bottom 3.4 mg/L |
Bottom 2.7 mg/L |
|||
|
Suspended Solids (SS) in mg/L |
23 |
or 120% of upstream control station at the same tide of the same day, whichever is higher |
37 |
or 130% of upstream control station at the same tide of the same day, whichever is higher |
|
Turbidity in NTU |
22.6 |
36.1 |
||
|
Total Alkalinity in ppm |
95 |
99 |
||
|
Representative Heavy Metals for early regular DCM monitoring (Chromium) |
0.2 |
0.2 |
||
|
Representative Heavy Metals for early regular DCM monitoring (Nickel) |
3.2 |
|
3.6 |
|
|
Action and Limit Levels SR1 |
|
|
|
|
|
SS (mg/l) |
To be determined prior to its commissioning |
To be determined prior to its commissioning |
||
|
Action and Limit Levels SR8 |
|
|
|
|
|
SS (mg/l) |
52 |
|
60 |
|
Note:
1. For DO measurement, non-compliance occurs when monitoring result is
lower than the Action or Limit Levels.
2. For parameters other than DO, non-compliance of water quality results
when monitoring results is higher than the Action or Limit Levels.
3. Depth-averaged results are used unless specified otherwise.
4. Details of selection criteria for the two heavy metals for early regular
DCM monitoring refer to the Detailed Plan on Deep Cement Mixing available on
the dedicated 3RS website http://env.threerunwaysystem.com/en/ep-submissions.html)
5. The action and limit levels for the two representative heavy metals
chosen will be the same as that for the intensive DCM monitoring.
Table 2.5: The Control and Impact
Stations during Flood Tide and Ebb Tide for General Water Quality Monitoring
and Regular DCM Monitoring
|
Control Station |
Impact Stations |
|
Flood Tide |
|
|
C1 |
IM1, IM2, IM3, IM4, IM5, IM6, IM7, IM8, SR3 |
|
SR2^1 |
IM7, IM8, IM9, IM10, IM11, IM12, SR1A, SR3, SR4A, SR5A, SR6, SR8 |
|
Ebb Tide |
|
|
C1 |
SR4A, SR5A, SR6 |
|
C2 |
IM1, IM2, IM3, IM4, IM5, IM6, IM7, IM8, IM9, IM10, IM11, IM12, SR1A, SR2, SR3, SR7, SR8 |
^1 As per findings of Baseline Water Quality
Report, the control reference has been changed from C3 to SR2 from 1 Sep 2016
onwards.
2.3.1 Analysis and Interpretation of
Monitoring Results
Summary
of Monitoring Results
Water quality monitoring was
conducted at 12 impact stations (IM), seven sensitive receiver (SR) stations
and three control stations in the vicinity of water quality sensitive receivers
around the airport island in accordance with the Manual. The purpose of water
quality monitoring at the IM stations is to promptly capture any potential
water quality impacts from the Project before the impacts could become apparent
at sensitive receivers (represented by the SR stations).
Water quality monitoring commenced
in August 2016. No marine construction works were conducted in August and
September 2016, and hence no adverse water quality impact associated with the
project was observed in August and September 2016.
During the monitoring period between
October and December 2016, the monitoring results for DO, total alkalinity, and
chromium obtained were in compliance with their corresponding Action and Limit
Levels. For turbidity, SS and nickel, some of the testing
results had exceeded the relevant Action Levels or Limit Levels during the
reporting period. Investigations
were carried out immediately for each of the exceedance cases, and the
investigation findings concluded that all the exceedances were not due to the
Project. Summaries of turbidity, SS, and nickel compliance status are presented
in Table 2.6 to 2.10.
Findings
for Turbidity Exceedance
Table 2.6 and Table 2.7 presents a summary of the
turbidity compliance status at IM and SR stations during mid-ebb and mid-flood
tide for the reporting period.
Table 2.6:
Summary of Turbidity Compliance Status at IM and SR Stations (Mid-Ebb Tide)
|
Date |
IM1 |
IM2 |
IM3 |
IM4 |
IM5 |
IM6 |
IM7 |
IM8 |
IM9 |
IM10 |
IM11 |
IM12 |
SR2 |
SR3 |
SR4A |
SR5A |
SR6 |
SR7 |
SR8 |
|
19/11/2016 |
|
|
|
|
|
|
|
||||||||||||
|
No. of Turbidity Exceedances |
0 |
0 |
0 |
1 |
0 |
0 |
0 |
0 |
0 |
0 |
0 |
0 |
0 |
0 |
0 |
0 |
0 |
0 |
0 |
Table 2.7: Summary of Turbidity
Compliance Status at IM and SR Stations (Mid-Flood Tide)
|
Date |
IM1 |
IM2 |
IM3 |
IM4 |
IM5 |
IM6 |
IM7 |
IM8 |
IM9 |
IM10 |
IM11 |
IM12 |
SR2 |
SR3 |
SR4A |
SR5A |
SR6 |
SR7 |
SR8 |
|
01/10/2016 |
|
|
|
|
|
|
|
||||||||||||
|
01/11/2016 |
|
|
|
|
|
|
|
||||||||||||
|
17/11/2016 |
|
|
|
|
|
|
|
||||||||||||
|
No. of Turbidity Exceedances |
0 |
0 |
0 |
0 |
0 |
0 |
0 |
0 |
1 |
1 |
0 |
1 |
0 |
0 |
0 |
0 |
0 |
0 |
0 |
Note: The
monitoring dates that are not presented in the above tables were in full
compliance with their corresponding Action and Limit Levels. Detailed results
are presented in Appendix D.
Legend:
|
|
No exceedance of Action Level and Limit Level |
|
|
Exceedance of Action Level recorded at monitoring station located downstream of the 3RS Project based on dominant tidal flow |
|
|
Exceedance of Action Level recorded at monitoring station located upstream of the 3RS Project based on dominant tidal flow |
|
|
Upstream station with respect to 3RS Project during the respective tide based on dominant tidal flow |
Investigations were conducted for
each of the exceedance cases and details of the investigation findings are
presented in the Construction Phase Monthly EM&A Report no. 10 and 11. All
exceedances were found not due to the Project.
IM Stations
Overall, the turbidity exceedances
that occurred during this reporting period appeared to be very sporadic and
isolated cases with neither temporal nor spatial trend to indicate that the
turbidity exceedances were linked to Project activities. Such isolated cases
appear to be more characteristic of natural fluctuation, and this is supported
by the baseline monitoring which also showed occasionally elevated turbidity levels
that are of a magnitude similar to or greater than the turbidity exceedances
that occurred during this reporting period.
SR
Stations
There
were no turbidity exceedances at any SR stations.
Findings for SS Exceedances
Table 2.8 and Table 2.9 presents a summary of the
SS compliance status at IM and SR stations during mid-ebb and mid-flood tide
for the reporting period.
Table 2.8:
Summary of SS Compliance Status at IM and SR Stations (Mid-Ebb Tide)
|
Date |
IM1 |
IM2 |
IM3 |
IM4 |
IM5 |
IM6 |
IM7 |
IM8 |
IM9 |
IM10 |
IM11 |
IM12 |
SR2 |
SR3 |
SR4A |
SR5A |
SR6 |
SR7 |
SR8 |
|
04/10/2016 |
|
|
|
|
|
|
|
||||||||||||
|
15/10/2016 |
|
|
|
|
|
|
|
|
|
|
|
|
|
|
|
|
|
|
|
|
20/10/2016 |
|
|
|
|
|
|
|
|
|
|
|
|
|
|
|
|
|
|
|
|
25/10/2016 |
|
|
|
|
|
|
|
|
|
|
|
|
|
|
|
|
|
|
|
|
12/11/2016 |
|
|
|
|
|
|
|
|
|
|
|
|
|
|
|
|
|
|
|
|
15/11/2016 |
|
|
|
|
|
|
|
|
|
|
|
|
|
|
|
|
|
|
|
|
19/11/2016 |
|
|
|
|
|
|
|
|
|
|
|
|
|
|
|
|
|
|
|
|
26/11/2016 |
|
|
|
|
|
|
|
|
|
|
|
|
|
|
|
|
|
|
|
|
29/11/2016 |
|
|
|
|
|
|
|
|
|
|
|
|
|
|
|
|
|
|
|
|
01/12/2016 |
|
|
|
|
|
|
|
|
|
|
|
|
|
|
|
|
|
|
|
|
03/12/2016 |
|
|
|
|
|
|
|
|
|
|
|
|
|
|
|
|
|
|
|
|
No. of SS Exceedances |
2 |
3 |
2 |
3 |
2 |
5 |
2 |
0 |
1 |
1 |
0 |
0 |
0 |
3 |
5 |
0 |
0 |
0 |
0 |
Table 2.9: Summary of SS Compliance
Status at IM and SR Stations (Mid-Flood Tide)
|
Date |
IM1 |
IM2 |
IM3 |
IM4 |
IM5 |
IM6 |
IM7 |
IM8 |
IM9 |
IM10 |
IM11 |
IM12 |
SR2 |
SR3 |
SR4A |
SR5A |
SR6 |
SR7 |
SR8 |
|
04/10/2016 |
|
|
|
|
|
|
|
||||||||||||
|
15/10/2016 |
|
|
|
|
|
|
|
|
|
|
|
|
|
|
|
|
|
|
|
|
20/10/2016 |
|
|
|
|
|
|
|
|
|
|
|
|
|
|
|
|
|
|
|
|
22/10/2016 |
|
|
|
|
|
|
|
|
|
|
|
|
|
|
|
|
|
|
|
|
25/10/2016 |
|
|
|
|
|
|
|
|
|
|
|
|
|
|
|
|
|
|
|
|
01/11/2016 |
|
|
|
|
|
|
|
|
|
|
|
|
|
|
|
|
|
|
|
|
03/11/2016 |
|
|
|
|
|
|
|
|
|
|
|
|
|
|
|
|
|
|
|
|
05/11/2016 |
|
|
|
|
|
|
|
|
|
|
|
|
|
|
|
|
|
|
|
|
08/11/2016 |
|
|
|
|
|
|
|
|
|
|
|
|
|
|
|
|
|
|
|
|
12/11/2016 |
|
|
|
|
|
|
|
|
|
|
|
|
|
|
|
|
|
|
|
|
15/11/2016 |
|
|
|
|
|
|
|
|
|
|
|
|
|
|
|
|
|
|
|
|
17/11/2016 |
|
|
|
|
|
|
|
|
|
|
|
|
|
|
|
|
|
|
|
|
19/11/2016 |
|
|
|
|
|
|
|
|
|
|
|
|
|
|
|
|
|
|
|
|
24/11/2016 |
|
|
|
|
|
|
|
|
|
|
|
|
|
|
|
|
|
|
|
|
29/11/2016 |
|
|
|
|
|
|
|
|
|
|
|
|
|
|
|
|
|
|
|
|
17/12/2016 |
|
|
|
|
|
|
|
|
|
|
|
|
|
|
|
|
|
|
|
|
20/12/2016 |
|
|
|
|
|
|
|
|
|
|
|
|
|
|
|
|
|
|
|
|
27/12/2016 |
|
|
|
|
|
|
|
|
|
|
|
|
|
|
|
|
|
|
|
|
No. of SS Exceedances |
2 |
3 |
3 |
1 |
0 |
1 |
1 |
0 |
0 |
1 |
2 |
3 |
0 |
0 |
6 |
1 |
9 |
0 |
0 |
Note: The
monitoring dates that are not presented in the above tables were in full
compliance with their corresponding Action and Limit Levels. Detailed results
are presented in Appendix D.
Legend:
|
|
No exceedance of Action Level and Limit Level |
|
|
Exceedance of Action Level recorded at monitoring station located downstream of the 3RS Project based on dominant tidal flow |
|
|
Exceedance of Action Level recorded at monitoring station located upstream of the 3RS Project based on dominant tidal flow |
|
|
Exceedance of Limit Level recorded at monitoring station located downstream of the 3RS Project based on dominant tidal flow |
|
|
Exceedance of Limit Level recorded at monitoring station located upstream of the 3RS Project based on dominant tidal flow |
|
|
Upstream station with respect to 3RS Project during the respective tide based on dominant tidal flow |
Investigations were conducted for
each of the exceedance case and details of the investigation findings are
presented in the Construction Phase Monthly EM&A Report no. 10, 11 and 12.
All exceedances were found not due to the Project.
IM Stations
Overall, it was observed that the SS
exceedances during this reporting period occurred frequently at those IM
stations which are located upstream of the 3RS Project, particularly during
mid-flood tide. Such exceedances at upstream stations would unlikely be
affected by the Project.
Separately, during mid-ebb tide, it
is observed that exceedances at IM stations occur at both upstream and
downstream stations on the same monitoring day. Such concurrent (upstream and
downstream) exceedances observed at these IM stations on the same monitoring
day suggest that there might be other sources of SS that were not related to
the Project.
SR
Stations
At SR stations, except for SR4A
during mid-ebb tide, exceedances occurred when the respective SR stations are
located upstream of the Project during mid-ebb and mid-flood tide, hence
exceedances at these upstream SR stations are unlikely to be due to the
Project. In addition, it is noted that similarly high SS levels were observed
at these SR stations during baseline monitoring, which suggested that such SS
elevations are not uncommon under ambient conditions due to natural
fluctuation.
Separately, a number of consecutive exceedances were observed affecting SR4A during
mid-ebb tide. While this SR station is located downstream of the Project during
mid-ebb tide, similar exceedances at the IM stations located between the
Project and the SR station were not observed on most of the monitoring days,
while the baseline monitoring results at SR4A showed similar high SS levels
during baseline monitoring. It is thus considered that such SS elevations are
not uncommon under ambient conditions due to natural fluctuation.
Findings
for Nickel Exceedances
Table 2.10 presents a summary of the nickel compliance
status at IM and SR stations for the reporting period. There
were no nickel exceedances during mid-ebb tide for the reporting period.
Table 2.10:
Summary of Nickel Compliance Status at IM Stations (Mid-Flood Tide)
|
Date |
IM1 |
IM2 |
IM3 |
IM4 |
IM5 |
IM6 |
IM7 |
IM8 |
IM9 |
IM10 |
IM11 |
IM12 |
SR2 |
SR3 |
SR4A |
SR5A |
SR6 |
SR7 |
SR8 |
|
22/11/2016 |
|
|
|
|
|
|
|
|
|
|
|
|
|
|
|
|
|||
|
No. of nickel Exceedances |
0 |
0 |
0 |
0 |
0 |
0 |
1 |
1 |
1 |
0 |
0 |
0 |
0 |
0 |
0 |
0 |
0 |
0 |
0 |
Note: The
monitoring dates that are not presented in the above table were in full
compliance with their corresponding Action and Limit Levels. Detailed results
are presented in Appendix D.
Legend:
|
|
No exceedance of Action Level and Limit Level |
|
|
Exceedance of Action Level recorded at monitoring station located downstream of the 3RS Project based on dominant tidal flow |
|
|
Exceedance of Action Level recorded at monitoring station located upstream of the 3RS Project based on dominant tidal flow |
|
|
Exceedance of Limit Level recorded at monitoring station located downstream of the 3RS Project based on dominant tidal flow |
|
|
Exceedance of Limit Level recorded at monitoring station located upstream of the 3RS Project based on dominant tidal flow |
|
|
Upstream station with respect to 3RS Project during the respective tide based on dominant tidal flow |
Investigations were conducted for
each of the exceedance cases and details of the investigation findings are
presented in the Construction Phase Monthly EM&A Report no. 11. All
exceedances were found not due to the Project.
IM
Stations
Nickel is a representative heavy
metal for DCM monitoring. It is worth noting that no DCM activities were
conducted during the monitoring period. Hence it is considered that occasional
elevations in nickel levels may arise due to other sources not associated with
the Project.
SR
Stations
There
were no nickel exceedances at any SR stations.
Conclusions
Based on the findings of the
exceedance investigations presented in Construction Phase Monthly EM&A
Report no. 10, 11 and 12, it was concluded that the exceedances during this
reporting period were not due to the Project. Hence no SR stations were
adversely affected by the Project. All required actions under the Event and Action
Plan had been followed. Exceedances appeared to be due to natural fluctuation
(such as naturally higher baseline SS levels at individual SR stations) or
other sources not related to the Project.
Nevertheless, recognising that the
IM stations represent a ‘first line of defense’, the
non-project related exceedances identified at IM stations have been attended to
as triggers of precautionary measures. As part of the EM&A programme, the
construction methods and mitigation measures for water quality will continue to
be monitored and opportunities for further enhancement will continue to be
explored and implemented where possible, to strive for better protection of
water quality and the marine environment.
2.4 Waste Monitoring
In
accordance with the Manual, the waste generated from construction activities
was audited once per week to determine if wastes were being managed in
accordance with the Waste Management Plan (WMP) prepared for the Project,
contract-specific WMP, and any statutory and contractual requirements. All
aspects of waste management including waste generation, storage, transportation
and disposal were assessed during the audits. The Action and Limit Levels of
the construction waste are provided in Table 2.11.
Table 2.11:
Action and Limit Levels for Construction Waste
|
Monitoring Stations |
Action Level |
Limit Level |
|
Construction Area |
When one valid documented complaint is received |
Non-compliance of the WMP, contract-specific WMPs, any statutory and contractual requirements |
Recommendations were provided during monitoring
including setup and implementation of the waste recording system, storage of
stockpiled materials, spill control and management, provision and proper
maintenance of drip trays for chemical containers, removal of oil stain on
ground as chemical waste on sites, proper disposal of sewage effluent from
construction workforce as well as proper collection, sorting and disposal of
Construction and Demolition (C&D) materials and general refuse. In addition,
relevant contractors were reminded to provide spill kit, personal protective
equipment in the spill kits and chemical storage area, and to handle the
chemical waste properly. The contractors had taken actions to implement the
recommended measures.
Under the P560(R) Contract, about
1,850 cubic metres of excavated materials were produced from the HDD launching
site and Sheung Sha Chau during the reporting period.
Such materials are temporarily stored at the stockpiling area and for reuse in
the Project.
In addition, metals and paper were
recycled. During the reporting period, around 46 tonnes of general refuse
and 0.5 tonnes of chemical waste were disposed of to the West New Territories
(WENT) Landfill and Tsing Yi Chemical Waste Treatment Centre respectively. No
C&D material was disposed off-site during the reporting period.
No exceedance of the Action or Limit
Levels was recorded in the reporting period.
2.5 CWD Monitoring
This section summarises the results
of the CWD monitoring effort over a 12-month period between 18 December 2015
and 31 December 2016 (covering 6-month baseline monitoring of the
pre-construction period and 6-month construction phase monitoring commencing on
1 August 2016), to gather information on the spatial and temporal distribution
patterns, abundance, and density of the CWD in the western Hong Kong waters.
Supplementary information collected focuses on northwestern
Lantau waters including the habitat use and behaviours of CWD before and during
the construction phase of the 3RS project has also been reviewed. Seasonal
variation has been considered using a whole year of data collected to
facilitate the review of the CWD encounter rate and Event and Action Plan.
2.5.1 Summary of Monitoring Requirements
CWD monitoring was conducted by
undertaking vessel line-transect surveys at a frequency of two full surveys per
month, supplemented by land-based theodolite tracking and Passive Acoustic
Monitoring (PAM). The frequency of the theodolite tracking was two days per
month at both the Sha Chau (SC) station and Lung Kwu
Chau (LKC) station during the 6-month baseline monitoring. The monitoring
frequency during the construction phase for marine works was one day per month
at both stations as stipulated in the Manual requirement. Additional theodolite
tracking at SC station and LKC station (in total 2 tracking days and 3 tracking
days per month at respective stations in both baseline and 6-month construction
phase for marine works) were also conducted on a voluntary basis to collect supplementary
information for the project. PAM was also deployed from January to December
2016 with a duty cycle of 20% for the baseline and construction phases with
data supplementing the results of both vessel and land-based surveys. For
detail on CWD monitoring and data analysis methodologies refer to Section
10.2.4 of the Manual. The locations of the CWD vessel survey transects are
shown in Figure 2.3, whilst the land-based
survey stations are described in Table 2.12 and depicted in Figure 2.4. The location of the
Passive Acoustic Monitoring devices are shown in Figure 2.5.
Table 2.12:
Land-based Survey Station Details
|
Stations |
Location |
Geographical Coordinates |
Station Height (m) |
Approximate Tracking Distance (km) |
|
D |
Sha Chau (SC) |
22° 20’ 43.5” N 113° 53’ 24.66” E |
45.66 |
2 |
|
E |
Lung Kwu Chau (LKC) |
22° 22’ 44.83” N 113° 53’ 0.2” E |
70.40 |
3 |
Construction phase monitoring of
CWDs commenced in August 2016, although there were no marine construction works
in August and September 2016. The Action Level (AL) and Limit Level (LL) for
CWD monitoring were formulated by an action response approach using the running
quarterly dolphin encounter rates (Encounter Rate by Number of Dolphin
Sightings ‘STG’ and Encounter Rate by Number of Dolphins ‘ANI’) derived from
baseline monitoring data, as presented in the CWD Baseline Monitoring Report.
The derived values of AL and LL for CWD monitoring are shown in Table 2.13.
Table 2.13: Derived Values of Action Level (AL)
and Limit Level (LL) for Chinese White Dolphin Monitoring
|
|
NEL, NWL, AW, WL and SWL as a Whole |
|
Action Level |
Running quarterly STG < 1.86 & ANI < 9.35 |
|
Limit Level |
Two consecutive running quarterly (3-month) STG < 1.86 & ANI < 9.35 |
2.5.2 Summary of Vessel
Line-transect Survey Monitoring Results
Survey Effort
Around 89.6% (i.e. 5,035.9 km) of the survey effort was conducted
under favorable weather condition (i.e. Beaufort 0-3 and visibility of approximately
1,200 m or beyond), that can be utilized for the analyses of encounter rates,
density and abundance of CWDs in western Hong Kong waters. The survey effort
data are provided in Appendix A of CWD Baseline Monitoring Report, Appendix E
of Quarterly EM&A Report No 3 and No.4.
Sighting Distribution
During mid-December 2015 to December 2016, 208 groups consisting of 785 CWD
individuals were sighted. Amongst these 208 groups of CWDs, 173 groups with 677
individuals were sighted during on-effort surveys under favourable weather
condition (i.e. Beaufort 0-3 and visibility of approximately 1,200 metres or
beyond).
The number of sightings by survey
area recorded that NWL comprised 46 groups of 181 CWDs, AW comprised 4 groups
of 16 CWDs, WL comprised 96 groups of 347 CWDs, while there were 62 groups of
241 CWDs in SWL. No CWDs were sighted in NEL during the entire reporting
period.
In NWL, most CWDs were sighted
within or in close vicinity of the Sha Chau and Lung Kwu
Chau Marine Park (SCLKCMP), particularly north off Lung Kwu
Chau, with a few sightings (including AW sightings) recorded at the
southwestern part of the survey area. No dolphins were sighted in the eastern
part of the survey area or within the 3RS land-formation footprint.
In WL, CWDs were quite evenly
sighted along the coast and off-shore waters from Sham Wat to Fan Lau, with
relatively more sightings near Fan Lau.
In SWL, CWDs frequented along the
coastal waters from Fan Lau to Shui Hau with more
sightings recorded in the western part of the survey area, especially near Fan
Lau. CWDs were also scattered around the western side of the Soko Islands.
The sighting locations of CWDs
during this reporting period are depicted in Figure 1 of Appendix E.
Encounter Rate
Two types of dolphin encounter rates were calculated based on the
data collected from mid-December 2015 to December 2016. They included the
number of dolphin sightings per 100 kilometres survey
effort (STG) and total number of dolphins per 100 kilometres
survey effort (ANI). The dolphin encounter rates were calculated by using
survey data collected under favorable weather condition only (i.e. Beaufort Sea
State 3 or below with favorable visibility).
From mid-December 2015 to December 2016, the combined STG and ANI of
CWDs (from NEL, NWL, AW, WL and SWL) were 3.44 and 13.44 respectively. Compared
by area, WL had the highest STG and ANI amongst the survey areas, followed by
SWL, AW and NWL. The encounter rate of NEL was zero as no dolphins were sighted
in the reporting period. By season, summer had the highest STG and ANI while
the lowest encounter rates occurred in winter. The highest STG and ANI both
occurred in July 2016 while the lowest STG and the lowest ANI appeared in
January and March respectively. Dolphin encounter rates by survey area and a
summary of monthly encounter rates are presented in Table 1 and Table 2 of Appendix E while
the trends of both monthly STG and ANI are presented in Figure 2 and Figure 3 of Appendix E.
For comparison with the Action/Limit levels for CWD monitoring,
running quarterly STGs and ANIs were calculated from the commencement of
construction phase monitoring in August 2016. No Action Level was triggered in
this reporting period. The running quarterly STGs and ANIs from August to
December 2016 are summarized in Table 2 of Appendix E while
the trends of both quarterly STG and ANI were presented in Figure 2 and Figure 3 of Appendix E.
The CWD Baseline Monitoring Report recommended a review of the
encounter rate levels adopted as Action and Limit Levels for
construction phase monitoring, as well as a review of CWD encounter rates
across different seasons after collection of 12 months CWD monitoring data. The
trends for the running quarterly STG and ANI from March to December 2016 (shown
in Figure 2 and Figure
3, Appendix E)
have been further reviewed, by comparing the seasonal variations of CWD
quarterly encounter rates with the Agriculture, Fisheries and Conservation Department (AFCD) long term marine mammals monitoring results over the past six years
(2010 to early 2016) covering the NEL, NWL, WL and SWL waters (Figure 4, Appendix E). The findings show that for both the
3RS monitoring results and AFCD long term records, the first quarter (i.e.
January to March) of the year is still the low season for CWD encounters, with
the values of STG and ANI consistently being the lowest during Q1. Seasonal
variation can be reflected in the AFCD long term records that the CWD running
encounter rates generally increase in Q2 and show a crest in Q3 (with some
exceptions in the timing of crest – peaks in April and November 2011, a crest
in Q4 2013 and a ‘late’ crest between September and November in 2015). Compared
to the seasonal variations reflected in the AFCD long term records, the running
quarterly encounter rates of the 3RS monitoring results (March to December 2016) were generally lower and with a narrower range (STG: 1.86 – 4.93; ANI:
8.99 – 21.75) throughout the year. The 2016 3RS monitoring data did not show a
significant high quarterly encounter rates for STG and ANI (peak at 4.9 and
21.8 respectively), while the lowest peak for AFCD from 2010 to 2015 was at
around 8 and 30 for STG and ANI respectively (AFCD 2016 peak season data is yet
to be available for comparison of the 2016 trend.) As the peak quarterly
encounter rates for STG and ANI values for 3RS baseline were still low, the
setting of another set of AL/LL with a narrow range of different values may not
represent the status of the peak season, therefore it is proposed to maintain
the existing AL/LL derived from the CWD Baseline Monitoring Report and to
further review when more data are available. Therefore, the encounter rates
previously established during the baseline monitoring period will continue to
be used and thus the Event and Action Plan remains unchanged.
Density and Abundance Estimation
Line transect analyses to estimate
the density and abundance of CWDs in Hong Kong waters during the time period of
this report were conducted (Table 3, Appendix E). Overall, estimates of density
and abundance were similar to those conducted by AFCD long-term dataset. As in
past analyses, the area with the highest abundance and highest density was West
Lantau (this has been consistent over the 21-year AFCD monitoring period).
Northeast Lantau still registered zero sightings and an abundance estimate of
zero, although recently some sightings of dolphins have been made in NEL by the
Hong Kong-Zhuhai-Macao Bridge (HZMB) monitoring efforts (L. J. Porter, pers.
comm. to T. A. Jefferson, Jan. 2017).
In addition to estimating year-round
abundance for each of the survey areas, a seasonal analysis was also conducted
(the pooled dataset from all survey areas have been used, as stratifying by
both survey area and season would reduce the sample sizes, and result in
estimates with unacceptably-low levels of precision). The seasonal estimates
(refer to Table 3 of Appendix E) were reasonably similar
and generally in line with what was expected from past research, with the
exception that the spring estimate was quite high, and this is higher than
expected from past work, where spring estimates were generally the low season
for dolphin numbers in Hong Kong.
Habitat Use
Habitat use of CWD amongst the
survey areas was examined by using quantitative grid analysis, both SPSE and
DPSE values were calculated in all grids amongst all survey areas for the time
period from mid-December 2015 to December 2016, for the first time for 3RS CWD
monitoring.
In this reporting period, the
important habitat of CWDs in NWL waters with high dolphin densities was north
of Lung Kwu Chau. In WL and SWL waters, the important
habitats of CWDs were near Tai O, Yi O, Peaked Hill and Fan Lau. The number of
on-effort dolphin sightings per 100 units of survey effort (SPSE) and number of
dolphins per 100 units of survey effort (DPSE) were calculated for the period
from mid-December 2015 to December 2016 and depicted in Figure 5 of Appendix E.
Group Size
During the period from mid-December 2015 to December 2016, group
size of CWDs ranged from one to 24 individuals, with an overall average of 3.77
± 3.09. The average group sizes of NWL, AW, WL and SWL were 3.93, 4.0, 3.61 and
3.89 respectively. By four solar seasons, the average group size of CWDs was
the highest in winter (4.21) but the lowest in autumn (2.91). The summaries of
the average group size of CWDs by survey areas and by seasons were presented in
Table 4 and Table 5 of Appendix E.
Small and medium sized CWD groups accounted for most of the
sightings during mid-December 2015 to December 2016 (48.1% and 47.1%
respectively). Only 10 sightings, that accounted 4.8% of the sightings,
contained 10 or more animals per group.
Both small and medium sized CWD groups were sighted throughout the
distribution range of dolphins in North, West and Southwest Lantau waters.
Medium sized CWD groups were sighted more than small sized groups in the
confluence of NWL, AW and WL survey areas where the HZMB Hong Kong Link Road
aligned. There were relatively more large sized CWD groups sighted in WL and
SWL than in NWL. In NWL, two large CWD groups were sighted in the area close to
Deep Bay. In WL, the large CWD groups were sighted in waters between Yi O and
Fan Lau. While in SWL, two large CWD groups were sighted in off-shore areas to
the west of the survey area, with another large group sighted near Fan Lau and
another was recorded in waters around Shek Pik. The sighting distribution of CWDs with different group
sizes is illustrated in Figure 6 of Appendix E.
Activities and Association with Fishing
Boats
Although vessel surveys do not
provide the most unbiased information on the behaviour and activities of
dolphins (due to the potentially disturbing presence of the vessel itself, and
also the low vantage point of small vessels), nonetheless behaviour and
activity data were collected from the vessel surveys.
During the reporting period from
mid-December 2015 to December 2016, a total of 84 and 16 groups of CWDs were
observed engaging in feeding and socializing activities, comprising of 40.4%
and 7.7% of all CWD sightings respectively. Moreover, 34 and 17 groups of CWDs
were sighted engaging in travelling and resting/milling activities
respectively. The sighting locations of CWD groups engaged in different types of
activities are depicted in Figure 7 of Appendix E.
Feeding activities mainly occurred
north of Lung Kwu Chau in NWL and along the coast of
WL and SWL, from Sham Wat to Shui Hau. Occasional
feeding activities were also observed in southwestern corner of SCLKCMP and AW
in NWL, and the central and western parts of Soko
Islands. Considering the sample size of sighting data of different survey
areas, AW has the highest percentage of feeding (although it should be kept in
mind that the sample size in AW was very small), followed by SWL (Table 6, Appendix E).
A total number of 15 sightings of
CWDs were observed associating with operating fishing boats, including gill
netters (three groups), purse seiners (10 groups), single trawlers (one group)
and pair trawlers (one group), accounted for 7.2% of all sightings. Although a
trawling ban has been implemented in December 2012, illegal trawling activities
were still often observed near the western and south-western borders of Hong
Kong. Two groups of CWDs, one in NWL and another in SWL were observed feeding
in association with trawling activities. Purse seiners were the most often observed
fishing boat type that CWDs associated with. The operation of purse seiners
with aggregated fisheries resources that the CWDs might have found beneficial
to associate with. Operations of purse seiners were often observed in northern
waters off Lung Kwu Chau and along the coastal waters
of WL and SWL where CWDs also frequented. The sighting locations of CWD groups
associated with operating fishing boats were depicted in
Figure 8 of Appendix E.
Socializing activities were mainly
sighted around Lung Kwu Chau and Fan Lau. Traveling
activities in NWL were mainly sighted in areas close to Deep Bay. While in WL,
traveling activities frequently occurred relatively off-shore from Yi O to Fan
Lau. There were also several sightings with traveling activities scattered in
SWL. In addition, resting/milling activities mainly occurred in WL and SWL.
Three sightings of resting/milling activities were sighted in waters around the
HZMB Hong Kong Link Road. The percentages of different activities for each of
the survey areas were shown in Table 6 of Appendix E.
Mother-calf Pairs
During the reporting period from
mid-December 2015 to December 2016, 15 out of all sightings were observed
having mother-and-unspotted calf, or mother-and-unspotted juvenile pairs. The
percentages of sightings with mother-calf pairs in NWL, WL and SWL were 8.7%,
6.3% and 8.0% respectively. These percentages were calculated by dividing the
no. of sightings with mother-calf pairs of a survey area by the total no. of
sightings of that survey area. The sighting distribution of mother-calf pairs
are depicted in Figure 9 of Appendix E.
Photo Identification – Summary
From mid-December 2015 to December
2016, a total number of 165 CWD individuals were identified altogether 365
times from all sightings. These 165 identified CWD individuals were divided
into three photo catalogues namely NL, WL and SWL accordingly to their first
sighting locations. NL, WL and SWL catalogues contain 49, 63 and 53 individuals
respectively. Amongst these 165 identified individuals, 82 (49.7%) were sighted
more than once.
The number of re-sightings of an
identified animal range from two to 10 times. The re-sighting rates (i.e.
number of identified individuals that were re-sighted more than once divided by
the total number of the identified individuals in the catalogue) of NL, WL and
SWL catalogues were 38.8%, 52.4% and 56.6% respectively. Twelve out of these 82
re-sighted individuals were sighted 5 times or more. The most frequently
re-sighted animals were NLMM006, NLMM013 and SLMM010, all were re-sighted 10
times from mid-December 2015 to December 2016. Summary of the
photo-identification of CWDs is presented in Table 7 of Appendix E.
Photo Identification – Range Use of
Identified CWD individuals
Re-sighting locations of identified
CWD provide a basic idea of the range use of the individual dolphin.
Despite the fact that a number of
identified CWD individuals were re-sighted in different survey areas, a
significant proportion of animals were observed not crossing between different
survey areas and were sighted in only one survey area repeatedly. For instance,
10 individuals occurred repeatedly in NWL only, 16 animals were re-sighted
within WL only, while 12 animals occurred repeatedly in SWL only. The
re-sighting locations of those re-sighted individuals that involved in NWL were
depicted in the location maps in Figure 10 of Appendix E to provide
indicative locations of their range used.
2.5.3 Summary of Land-based Theodolite Tracking Monitoring Results
Survey Effort
During mid-December 2015 to December 2016, a
total of 59 days (including 60 survey sessions) and 361:49 (hh:mm)
of land-based theodolite survey effort have been accomplished (Table 8 of Appendix E for summary, raw data
refer to Appendix E of CWD Baseline Monitoring Report, Quarterly EM&A Report
No. 3 and No.4). A total of 128 CWD groups were tracked from land, with 126
from the LKC station, and two from the SC station (Table 9 and Figure 11 of Appendix E). After the raw data were
filtered, 51 CWD group focal follows from LKC and one from SC fit criteria for
analyses. From these focal follow tracks, 78 and three 10-minute segments from
LKC and SC respectively, were extracted for analyses. CWD group sighting per
survey effort was 0.58 from LKC and 0.01 from SC.
Time of Day
The diurnal pattern of CWDs was
calculated by dividing the total tracking time of CWD groups (prior to
filtering data) by the total effort per hour block. Off LKC, the highest
percentages of CWD groups (per hour of effort) were during the 1000 hour block
(18.91%) and 1400 hour block (19.64%) (Figure 12 of Appendix E). The two groups recorded
off SC were tracked during the 1000 and 1100 hour blocks only.
Time of Year
The highest percentage of CWD groups
observed from LKC was during the 5th study period, between
18 April and 17 May 2016 (18.25%), as the wet season began, and the lowest
percentage observed was during the 4th study period, between 18
March and 17 April 2016 (1.59%). CWDs were only observed from SC during the 6th
and 8th survey months between 18 May and 17 June, and August 2016.
For details, refer to Figure 13).
Group Size
The mean group size of CWD filtered
tracks off LKC was 3.08±1.81, ranging from singletons to a maximum group size
of 9. The sighting distribution of CWDs relative to group sizes is represented
in Figure 14 of Appendix E. Singletons were most often
observed near shore and group sizes of CWDs were largest around the SCLKCMP
boundary where ferry traffic is routed around the perimeter of the marine park.
The mean group size of CWDs was 2.59±1.64 (n=37) within the park, 3.19±1.44
(n=25) outside of the park, and 3.85±2.39 (n=16) crossing the marine park
boundary. A basic one-way ANOVA and sequential Bonferonni
post hoc test showed a significantly larger mean group size, at alpha level
0.05, of CWDs around the marine park boundary than those within the marine park
(p=0.016). As will be mentioned in discussion, this trend may reflect
sighting bias wherein single individuals may be more difficult to locate
farther from the survey platform and easier to find and track larger group
sizes at greater distances. However, CWD group sizes were not significantly
larger beyond the park boundary relative to those around the boundary
perimeter.
Group size of CWDs within 500 m of
diverted SkyPier HSFs (<15 knots) was 3.50±2.07
(n=8), and for non-SkyPier HSFs (≥15 knots)
was 4.29±2.69 (n=7). Group size with no vessels within 500 m was
2.91±1.64 (n=58). A basic one-way ANOVA showed no significant differences
in group size based on vessel type present (p=0.122). While not significantly
different, possibly due to small sample sizes in the presence of ferries, the
possibility exists that dolphins more often aggregate together in the presence
of vessels, especially those moving at high speed.
Only two groups, both with 4
individuals, were observed off SC (shown in Figure 15 of Appendix E). Detailed information on
group size is shown in Table 10 of Appendix E.
Behavioural State
Excluding
the unknown behavioural category from the filtered segments, foraging and
travelling were observed most frequently (40.91% and 28.57%, respectively), and
milling, resting, and socialising were observed least frequently (2.60%, 3.68%,
and 5.84%, respectively) off LKC (Figure 16 of Appendix E). Travelling was the only
behaviour recorded off SC.
Vessel Activity
Off LKC, vessels were recorded
within 500 meters of focal CWD groups on 20 occasions (based on filtered 10-min
segments), including diverted SkyPier HSFs under
speed restriction on 8 occasions, non-SkyPier HSFs on
7 occasions, and other vessels (e.g., fishing and government vessels) on 5
occasions. A basic one-way ANOVA showed a significant difference at the 0.05
alpha level in CWD speed relative to vessel type present (p=0.015), and no
significant differences in CWD reorientation rate (p=0.518) or linearity
(p=0.128) relative to vessel type present. A sequential Bonferonni
post hoc test showed a significant difference in CWD speed at alpha level 0.05
when diverted SkyPier HSFs under speed restriction
were present (p=0.003) compared to no vessels present. There was also a
significant difference in CWD speed at alpha level 0.1 when non-SkyPier HSFs were present (p=0.066) compared to no vessels
present. There was no difference in CWD speed when other vessels were present
(p=0.516).
There was no significant difference
in CWD swimming speed, reorientation rate, or linearity based on high speed
ferry presence when compared to slower speed ferry presence. However, sample
sizes for the vessel categories are very small (e.g., all <15 samples), and
therefore not robust, and should be interpreted with caution. The small sample
sizes may reflect CWD potential avoidance of vessels off LKC.
CWD fine-scale movement patterns off
LKC varied based on natural and artificial factors. CWDs swam slower and
changed bearing more often when foraging than when travelling, as expected.
CWDs generally swam in a less linear fashion when in larger social groupings.
CWDs also swam significantly faster when moving across and outside of the
marine park boundary. Although the SCLKCMP is an artificial construct lacking
physical barriers, there are tangible differences based on vessel restrictions
and operating routes within and beyond the designated area. Movement patterns
did not change significantly relative to vessel presence, including high speed
ferries and high speed ferries under speed restrictions. However, sample size
in this category was low. CWDs may actively avoid vessels; for example,
swimming quickly away from vessels when approaching the marine park boundary,
making detection of groups within 500 m of a vessel less likely. The high-speed
ferry speed restrictions in the area may allow dolphins to change course and
swim away from oncoming vessels moving at slower speeds.
2.5.4 Summary of Passive
Acoustic Monitoring Results
Dolphin Detection Rates Per Day
During the period of 8 Jan to 28 Dec 2016 (Deployments 1 through 7),
dolphins were detected at site A5 (location refers to Figure 2.5) in a total of 210 of
74,234 files (0.28% of files) (Table 11 of Appendix E).
Dolphins were detected on 104 of 261 (40%) days with recording effort (Table 11 and Figure 17 of Appendix E).
On days with dolphins detected, the mean percentage of files with detections
per day was 0.7%, and the maximum percentage of files with dolphin detections
was 4.17%, on 7 Feb 2016 (Figure 17 of Appendix E).
Clicks (including burst pulses) were the predominant type of dolphin signal
detected (n = 209 detections). Of these, 18 were noted to be burst pulses and
they were detected in the months of October through December 2016. Only one
whistle was detected in data from this monitoring period, recorded on 27
November 2016.
Dolphin detection rates were greatest during winter and spring
months (January through May) and lowest in summer, and showed a slight increase
again in autumn (Figure
17 of Appendix E).
During Deployments 1, 2, 3 and 6 (8 Jan – 13 May and 6 Oct – 7 Nov 2016),
dolphins were detected on 40% - 65% of recording days, and in 0.2% - 0.6% of
files on average. Detection rates were lower during Deployments 4, 5 and 7 (20
May – 12 Sep and 17 Nov – 28 Dec 2016), in which dolphins were detected on 29%,
18% and 24% of recording days respectively, and in 0.1% of files (Figure 17 of Appendix E).
These values represent reductions in the same metrics compared to
previous monitoring at site A5 in 2013. During the comparable time period of 8
Jan to 7 Dec 2013 (the last day of recording effort for the previous EIA
study), dolphins were present on 206 of 284 recording days (73%) (Figure 18 of Appendix E).
In 2013, dolphins were detected in 763 of approximately 81,790 files (0.93% of
files), and on days with dolphins the mean percentage of files with detections
was 1.3%, nearly double the mean percentage of files on days with dolphins in
2016 (0.7%). The percentage of files per day with dolphin detections exceeded
4% on 11 days during the 2013 time period, whereas in 2016 the percentage of
files with dolphin detections exceeded 4% on only one day.
Dolphin Diel Pattern
Dolphin detection rates at A5 from 8 Jan to 28 Dec 2016 were greater
at night than during daytime and exhibited a clear diel pattern, with peak
detection hours between 2100-2200 and 0200-0300 (Figure 19 of Appendix E).
This pattern of detection was similar compared to the 2013 monitoring period,
with higher numbers of detections during night-time and fewest detections at
midday (as seen throughout Hong Kong waters, in general). No seasonal
differences in the diel pattern were evident, although the overall numbers of
detections in summer and autumn were lower than in winter and spring (Figure 20 of Appendix E).
Sound Pressure Levels Per Day
Ambient received noise levels (referred to as sound pressure levels
or SPL) at the EAR were calculated for each recording within the full effective
frequency bandwidth (~0 to 32 kHz) as well as octave bands of 0-2 kHz, 2-4 kHz,
4-8 kHz, 8-16 kHz, and 16-32 kHz. Mean sound pressure levels over the full
bandwidth ranged from approximately 104 to 117 dB rms
re 1 µPa over the recording period (Figure 21 of Appendix E).
Mean sound pressure levels were approximately 5 dB lower in winter through
early spring (Jan-Mar) compared to late spring and summer (Apr-early Sep) in
all frequency bands. During the period of 5-10 Feb 2016, sound pressure levels
in the 0-2 kHz band declined sharply by approximately 7 dB (affecting the full
band level as well), this was likely due to less marine traffic during the
period of Lunar Chinese New Year contributing to this "dip", and
"normal" levels resumed after the public holiday.
Sound pressure levels in the 16-32 kHz band, in which energy from
CWD clicks occurs, ranged from approximately 95 to 103 dB, and were 3-5 dB
lower in winter and spring compared to summer and autumn (Figure 21 of Appendix E).
Indo-Pacific humpback dolphin click and whistle frequencies are above 16 kHz
and below 10 kHz, respectively (Sims et al. 2011); however, these sounds were
very rare in the data compared to other sound sources and would not be
distinguishable in ambient noise plots.
Influence of Ambient Sound Level on Dolphin Detections
The extent to which ambient received sound levels influenced
detectability of dolphin signals is not quantified for this data set. However,
the daily mean SPL for A5 in 2016 (Figure 21 of Appendix E) was similar to
values reported for the same site over the same period in corresponding octave
bands in 2013, to within approximately ± 2 dB (Figure 22 of Appendix E).
Therefore, the potential masking effect of background noise on dolphin signals
in 2016 was comparable to any masking effect in 2013. This suggests that the
lower dolphin detection rate in 2016 compared to 2013 reflects a true reduction
in dolphin signals, rather than an increase in background noise resulting in increased
masking of signals.
Diel Sound Pressure Level
Mean sound pressure levels plotted by hour revealed a daily peak
during the hours of 1700-1900, which was most pronounced in the 0-2 kHz
frequency band (Figure
23 and Figure 24 of Appendix E).
This daily peak was most pronounced in spring and summer months (March-August),
subsided in autumn, and was not distinctive in winter. This seasonally shifting
peak is similar to the diel pattern of sound pressure levels reported during
previous Hong Kong PAM efforts (Munger et al. 2016),
and is hypothesized to be related to a local fish chorus, probably dominated by
croakers (family Sciaenidae). Sound pressure levels
in the 16-32 kHz band remained relatively flat and constant (within 2 dB)
throughout all hours of the day (Figure 23 and Figure 24 of Appendix E).
The contribution of daily vessel traffic and anthropogenic noise can
best be seen in the winter plot, where the fish chorus peak is weak or absent.
Full-bandwidth sound pressure levels begin to increase at 0700 throughout the
day and reach a maximum of >110 dB in the afternoon; SPL then decreases after
1900 throughout the night to minimum values of ~107 dB between 0300 and 0500
(Figure 23 of Appendix E).
2.5.5 Discussions on CWD
Monitoring Results
This report summarises the findings
of the 12-month CWD monitoring results from mid-December 2015 to December 2016
for the 3RS Project. Overall, while the general patterns emerging from the
vessel-based survey work are along the lines of what would be expected from our
previous experience, they have also provided important information on the
shifting patterns of dolphin use of the area of western Hong Kong, as both
environmental and anthropogenic changes affect the habitat of the animals in
complex and sometimes-unpredictable ways. However, for the most part, our
observations fit into the expected behavior of
dolphins shifting away from the parts of their habitat that are most affected
by potentially-disturbing marine construction activities (such as some aspects
of land reclamation) and high-speed vessel traffic. Both previous
observations of CWDs in Hong Kong and information from the literature on
responses of closely-related species of marine mammals predict such behavior, and this is indeed what is being observed (note
the much-decreased use of NEL and NWL, and increased use of SWL in the recent
decade or so). Our previous experience would also lead us to believe that
dolphins will indeed shift back into at least some of those habitat areas once
the disturbing factors are lessened (3RS approved EIA (Mott MacDonald, 2014)
and Hoyt 2011), and assuming that the overall population is still reasonably
robust and the habitat receives effective protection from the main
threats. The monitoring work that we will conduct over the next several years
will be focused on determining whether in fact this has been the case with CWDs
in Hong Kong. Certainly, the protection of important habitat areas where
the dolphins have historically done much of their feeding and calf-rearing
activities will help to ensure that this will be the case.
Vessel survey data from this
monitoring period found no CWDs in the NEL area. There is initial indication
that SWL and WL areas are being more heavily used by CWDs, and this may have
resulted from CWDs shifting their activities to parts of their home range in
SWL and WL waters to avoid the NEL area. Similar findings on shifting of
habitat use of some dolphins from northern Lantau to west and southwest Lantau
waters were recorded in 2015 by the AFCD study (Hung, 2016). However, despite
these changes, some regions within North Lantau waters are still being used as
important dolphin habitat (especially the area around Lung Kwu
Chau and the Urmston Road area near Castle Peak).
Based on theodolite data, the waters
off Lung Kwu Chau remain an important foraging area
for CWDs throughout the year. Relative occurrence peaked in April 2016,
concurrent with the beginning of the wet season. No clear pattern of occurrence
emerged off LKC relative to 3RS construction activities. Group sizes of CWDs
were generally smaller closer to shore, with the largest groups occurring in
closer proximity to the SCLKCMP boundary, at times beyond the marine park. It
is possible that this perception of group size difference close to shore vs.
further from shore is an artefact due to the fact that dolphins are more easily
seen and tracked from shore when at greater distance when they are in larger
group sizes. Further work will hopefully clarify this present uncertainty.
There were very few CWDs observed
off Sha Chau, only 2 groups observed throughout the entire year. The only
behaviour observed from this location was travelling, suggesting that CWDs are
simply moving through this area to more suitable habitat. This is a
sharply-reduced use of the area north of the airport and south of the Sha
Chau/Lung Kwu Chau Marine Park from earlier studies,
as expected relative to increasing marine works in this area. However,
night-time recordings of CWDs indicated that use is not as low as detected by
vessel and shore-based work alone.
The passive acoustic monitoring
(PAM) data continue to provide useful information, especially on patterns of
dolphin vocalization at night, which has previously been unavailable to us. The
diurnal detection of clicks showed a consistent pattern of higher levels at
night compared with the day, which may be indicative of increased use of
echolocation by dolphins during hours of darkness.
The PAM data provide evidence that
dolphins are using the area around A5 throughout the year. Dolphins were
present on more than half the recording days (59-65%) in winter and early
spring (Jan-Mar), and on 18-42% of days in the late spring through autumn. The
per-file detection rates were also highest in winter and spring; taken
together, these metrics suggest that dolphins use the A5 area more frequently
and intensively in winter and spring than in the summer. Dolphins were detected
more frequently during nighttime hours than during
the day, and this may be related to increased nocturnal foraging behaviour
and/or avoidance of the A5 area during the day when anthropogenic activity is
greater.
Dolphin detection rates were
considerably lower in 2016 than in 2013 at the same monitoring site. This
probably represents a true decrease in dolphin detections rather than increased
masking of signals, as the ambient noise levels were comparable between years.
2.5.6 Conclusions of CWD Monitoring
Results
Although the analyses presented in
this report will be updated with larger datasets in the future, as the construction
phase for the 3RS continues, it is a good beginning on the process of building
up data to examine the potential effects of the 3RS construction, and also to
evaluate effectiveness of mitigation measures. Several findings can be
made at this point, although some of these should be considered preliminary.
Key
Findings:
1.
In general, findings
from this study are consistent with findings from the long-term monitoring
commissioned by AFCD,
2.
Dolphins have remained
extremely uncommon around the Brothers Islands of NE Lantau,
3.
Both SW Lantau and W
Lantau were being used more heavily in 2016 than in the past, likely due to
dolphins moving away from the more disturbed habitats in NW and NE Lantau (e.g.
potential disturbance from HZMB projects including the HKBCF, the Hong Kong
Link Road and other associated projects),
4.
There have been no
exceedances of the encounter rate Action and Limit Levels derived from the CWD
Baseline Monitoring Report during the first six month of impact monitoring,
5.
Waters around Lung Kwu Chau remain an important year-round habitat, especially
for foraging,
6.
Average annual
abundance in Hong Kong’s western waters covering NWL, AW, NEL, SWL and WL was
estimated at 60 individuals in 2016 from line-transect analysis,
7.
Relative occurrence
from land-based surveys around LKC peaked in spring, concurrent with the start
of the wet season,
8.
Group sizes of CWDs
were generally smaller closer to shore, with larger groups in closer proximity
to the Sha Chau and Lung Kwu Chau Marine Park
boundary,
9.
CWDs had slower
swimming speeds and changed direction more frequently when foraging than when
traveling,
10.Shore-based
work found very few dolphin groups off Sha Chau (much reduced from past
levels),
11.Acoustic
monitoring showed consistently higher levels of clicking activity at night,
which may indicate increased using of echolocation by dolphins during hours of
darkness,
12.Dolphins used
the area around PAM A5 throughout the year, but with increased activity during
winter and spring months, and
13.Dolphin
acoustic detection rates were lower in 2016 than in 2013 at the same site,
which is consistent with the decreased use of the NW Lantau area, as seen from
the visual survey work.
Each main survey type (i.e. vessel-based
line transect and photo-identification surveys, land-based surveys with
theodolite-tracking, and passive acoustic monitoring) provides important data
that are complementary, and when analysed together, they provide a robust
dataset to examine the kinds of issues that need to be considered for proper
management and conservation of the dolphins.
2.5.7 Site Audit for CWD-related
Mitigation Measures
During the reporting period, silt
curtains were in place by the contractors for sand blanket laying works and at
least two dolphin observers were deployed by each contractor in accordance with
the Marine Mammal Watching Plan. Teams of at least two dolphin observers were
deployed by contractors for continuous monitoring of the Dolphin Exclusion Zone
(DEZ) for DCM trial works in accordance with the DEZ Plan. Trainings for the dolphin observers on the implementation
of MMWP and DEZ monitoring were provided by the ET prior to the
aforementioned works, with the training records kept by the ET. Testing on night
vision devices for Dolphin Exclusion Zone monitoring was also conducted before
the DCM trials. From the contractors’ MMWP observation records and DEZ
monitoring records, no dolphins or other marine
mammals were observed within or around the DEZ and silt curtains during the
reporting period. These contractors’ records were also audited by the ET
during site inspection.
Audits of acoustic decoupling for
construction vessels were carried out during weekly site inspection and
summarised in Section 2.6. Summary of audits of SkyPier
High Speed Ferries route diversion and speed control and construction vessel
management are presented in Section 2.8 and Section 2.9 respectively.
2.6 Weekly Environmental Site Inspection
Site inspections of the construction
works were carried out on a weekly basis to monitor the implementation of
proper environmental pollution control and mitigation measures for the Project.
Bi-weekly site inspections were also conducted by the IEC. Observations
have been recorded in the site inspection checklist and passed to the
contractor together with the appropriate recommended mitigation measures where
necessary.
The key observations from site
inspection and associated recommendations were related to:
● display of Non-road mobile machinery
(NRMM) labels for generators;
● improvement of dust control and
spill prevention measures;
● provision of wheel washing
facilities for vehicles before leaving the construction site;
● display of noise emission labels for
air compressors;
● improvement of efficiency and
capacity of wastewater treatment facilities;
● provision of sandbags around the
gully to prevent surface runoff;
● better maintenance of drainage
channel;
● sewage effluent from construction
workforce;
● provision and proper maintenance of
drip trays for chemical containers;
● removal of oil stains on ground as
chemical waste;
● review of the capacity of chemical
waste storage area;
● proper collection, sorting and
disposal of inert and non-inert C&D materials;
● display of Environmental Permit at
site entrance; and
● erection of site hoarding.
In addition, recommendations were
provided during site inspection on construction vessels, which include:
● provision of spill kit and chemical
waste storage area for the chemical waste;
● display of Environmental Permit;
● provision of spare silt curtain on
required construction vessels; and
● provision of acoustic decoupling for
noisy equipment.
In addition,
CNP compliance check of the use of powered mechanical equipment for Contract
P560(R) during restricted hour at the launching site was carried out by the ET
on 11 July 2016. The use of powered mechanical equipment was complied with the
requirements of CNP.
The daily visual inspection checklists
for silt curtains and bi-weekly diver inspection records which were implemented
by the contractors in accordance with the Silt Curtain Deployment Plan had been
checked during site inspection, summarizing that the silt curtains were
maintained in the correct positions and intact without obvious defects or
damage.
A summary of
implementation status of the environmental mitigation measures for the
construction phase of the Project during the reporting period is provided in Appendix C.
2.7 Ecological Monitoring
In
accordance with the Updated EM&A Manual, ecological monitoring shall be
undertaken monthly at the HDD daylighting location on Sheung Sha Chau Island to identify and evaluate any impacts with appropriate
actions taken as required to address and minimise any adverse impact found.
Monthly ecological monitoring was
carried out in March, August, September, October, November and December 2016 on
Sheung Sha Chau Island. No encroachment into the egretry area at Sheung Sha Chau
by the HDD daylighting location or mooring of flat top barge was recorded
during ecological monitoring.
2.8 Audit of the SkyPier Plan
During the initial implementation
period, the SkyPier HSFs encountered occasional
difficulties as reported by Ferry Operator (FO) in strictly observing the
15-knot speed limit throughout the SCZ. Further training workshops for the SkyPier operators who operate the diverted route to Zhuhai
and Macau were held in January 2016 and March 2016 to ensure their full
understanding of and adherence to the routing and speed control requirements.
The situation has considerably improved in February and March 2016 by
undertaking training workshops, and ferry movement monitoring and audit. The
IEC has also performed audit on the compliance of the requirements as part of
the EM&A programme. The latest summary of compliance of SkyPier
Plan between 1 April 2016 and 31 December 2016 is presented in Table 2.14.
Four skipper workshops
were held from May to December 2016 with ferry operators and relevant ferry
captains to refresh
their understanding about the requirements of the SkyPier
Plan such as the routing and speed control requirements with discussion on the
deviation cases, experience sharing and recommendations to strengthen the
implementation of SkyPier Plan.
In total, 10,043 ferry movements
between HKIA SkyPier and Zhuhai / Macau were audited
in the reporting period. The daily movements of all SkyPier
HSFs in the reporting period ranged between 1 and 97, which falls within the
maximum daily cap number of 125. There were fewer ferry movements on 1st, 2nd
August and 21st October due to typhoon.
The annual daily average of all SkyPier HSF movements
in 2016 was 91, which falls within the annual daily average cap of 99 SkyPier HSF movements.
Most
of the HSFs travelled through the SCZ with average speeds below 15 knots, which
complied with the SkyPier Plan. Three cases of
average speed deviation were due to public safety. All ferry movements that
were not strictly following the diverted route have been investigated.
Insufficient Automatic Identification System (AIS) data were received from some
HSFs due to interference
effect of AIS signal as reported by the FO after checking the condition of the
AIS transponders. In such cases, vessel
captains were requested to provide the radar track photos which indicated that
the vessel entered the SCZ though the gate access point and no speeding in the
SCZ.
Table 2.14
Summary of Key Audit Findings against the SkyPier
Plan
|
Requirements in the SkyPier Plan |
Apr-16 |
May-16 |
Jun-16 |
Jul-16 |
Aug-16 |
Sep-16 |
Oct-16 |
Nov-16 |
Dec-16 |
|
Total number of ferry movements recorded and audited |
805 |
837 |
816 |
836 |
809 |
814 |
839 |
837 |
867 |
|
Use diverted route and enter / leave SCZ through Gate Access Points |
800 |
836 |
811 |
829 |
802 |
813 |
835 |
832 |
866 |
|
No. of SkyPier HSFs in compliance with Average Speed within 15 knots in SCZ |
805 |
837 |
815 |
836 |
809 |
814 |
839 |
836 |
867 |
|
Daily Cap (including all SkyPier HSFs)
|
86-95 |
88-95 |
88-96 |
88-94 |
10-94 |
87-95 |
1-96 |
88-93 |
87-93 |
Source:
excerpt from Monthly and Quarterly EM&A Reports
Note: There were fewer ferry movements on 1st
and 2nd August 2016 (52 and 10 movements respectively) due to
typhoon.
There was only
one HSF movement on 21st October 2016 due to typhoon Signal No. 8 on
that day.
2.9 Audit of Construction and Associated
Vessels
Deviations
including speeding in the works area, entry from non-designated gates, not
following the designated route and entering no-entry zones were identified. All
the concerned contractors were reminded to comply with the requirements of the
MTRMP-CAV during the weekly MTCC audit and such deviations were also reviewed
and highlighted during the monthly Environmental Management Meeting.
A total of 24
skipper training workshops have been held by ET between August and December
2016 with 299 concerned captains of construction vessels associated with the
3RS contracts to familiarise them with the
predefined routes, general education on local cetaceans, guidelines for
avoiding adverse water quality impact, the required environmental practices /
measures while operating construction and associated vessels under the Project,
and guidelines for operating vessels safely in the presence of CWDs. Another 18
skipper training workshops have been held with 83 captains by contractor’s
Environmental Officers (EO) and competency tests had been conducted
subsequently with the trained captains by ET. In addition, ET
had participated Marine Management Liaison Group meetings to assist and resolve any marine
issues which might be encountered under 3RS Project.
2.10 Review of the Key Assumptions
Adopted in the EIA Report
With reference to Appendix E of the
Manual, it is noted that the key assumptions adopted in approved EIA report for
the construction phase are still valid and no major changes are involved. The
environmental mitigation measures recommended in the approved EIA Report remain
applicable and shall be implemented in undertaking construction works for the
Project.
3
Report on Non-compliance, Complaints, Notifications of
Summons and Prosecutions
3.1 Compliance with Other Statutory
Environmental Requirements
During the reporting period,
environmental related licenses and permits required for the construction
activities were checked. No non-compliance with environmental statutory
requirements was recorded.
3.2
Analysis
and Interpretation of Complaints, Notification of Summons and Status of
Prosecutions
3.2.1
Complaints
An environmental complaint
was received on 29 December 2016 regarding night time work at Sheung Sha Chau. Investigation was conducted by the ET in
accordance with the Manual and the Complaint Management Plan (CMP) of the
Project. The contractor of Contract P560(R) Aviation Fuel Pipeline Diversion
Works reported that emergency rescue works had to be carried out in view of the
unexpected ground condition at Sheung Sha Chau. Such
emergency rescue works were considered as crucial and vital in order to avoid
building up of excessive drilling fluid pressure, which might lead to an
uncontrollable spillage outside the contaminant pit, causing significant
environmental impact at Sheung Sha Chau. Subsequent
to the emergency rescues, the contractor has already taken immediate actions to
improve the drilling fluid system as well as strengthen the control and
communication measures with all relevant parties. ET will continue to closely
monitor the implementation and effectiveness of the remedial measures in preventing
re-occurrence of similar events.
3.2.2 Notifications of Summons or Status
of Prosecution
During the
reporting period, no notifications of summons or prosecution were received.
3.3 Cumulative Statistics
Cumulative
statistics on exceedance, non-compliance, complaints, notifications of summons
and status of prosecutions are summarized in Table 3.1 and Table 3.2.
Table 3.1:
Statistics for Valid Exceedances for the Environmental Monitoring
|
|
|
Total no. recorded in the reporting month |
Total no. recorded since the project commenced |
|
1-hr TSP |
Action |
0 |
0 |
|
|
Limit |
0 |
0 |
|
Noise |
Action |
0 |
0 |
|
|
Limit |
0 |
0 |
|
Waste |
Action |
0 |
0 |
|
|
Limit |
0 |
0 |
|
Water |
Action |
0 |
0 |
|
|
Limit |
0 |
0 |
|
CWD |
Action |
0 |
0 |
|
|
Limit |
0 |
0 |
Remark: Exceedances,
which are not project related, are not shown in this table.
Table 3.2:
Statistics for Non-compliance, Complaints, Notifications of Summons and
Prosecution
|
Reporting Period |
Cumulative Statistics |
|||
|
|
Non-compliance |
Complaints |
Notifications of Summons |
Prosecutions |
|
This reporting period |
0 |
1 |
0 |
0 |
|
From 28 December 2015 to end of the reporting period |
0 |
1 |
0 |
0 |
4
Conclusion and Recommendation
In the reporting period from 28
December 2015 to 31 December 2016, the EM&A programme has been implemented
in accordance with the Manual of the Project. The EM&A works carried
out during the reporting period include construction dust and noise
measurements, water quality monitoring, ecological monitoring on Sheung Sha Chau Island, vessel line-transect surveys,
land-based theodolite tracking surveys supplemented with passive acoustic
monitoring for CWD monitoring as well as environmental site inspections and
waste monitoring for the Project’s construction works.
During the reporting period, five exceedance
cases involving Action Level of 1-hour TSP monitoring were recorded during the
reporting period. Investigations were carried out immediately for each of the
exceedance cases. The investigation results indicated that the exceedances were
not related to the Project. There were, however, no exceedance cases
involving Limit Level of 1-hour TSP monitoring throughout the reporting period.
For water quality, the monitoring
results for DO, total alkalinity, and chromium obtained during the reporting
period were in compliance with their corresponding Action and Limit Levels. For
turbidity, SS and nickel, some of the testing results exceeded the relevant
Action or Limit Levels during the reporting period. Investigations were carried out immediately
for each of the exceedance cases, and the investigation findings concluded that
all the exceedances were not due to the Project.
No breach of the Action or Limit
Levels in relation to the construction noise, waste and CWD monitoring were
recorded during the reporting period.
All site observations made by the ET
were recorded in the site inspection checklists and passed to the contractor
together with the recommended follow-up actions. No encroachment or disturbance
to the egretry area on Sheung
Sha Chau was recorded during monthly ecological monitoring.
A
total of 5,619.7 km survey effort was conducted for the vessel line transect
monitoring for CWD during the 12-month monitoring period. A total of 208
groups of 785 CWD individuals were sighted, with 46 groups of 181 CWDs recorded
in NWL, 4 groups of 16 CWDs in AW, 96 groups of 347 CWDs in WL and 62 groups of
241 CWDs in SWL. No CWDs were sighted in NEL during the 12-month reporting
period. The combined encounter rate by number of dolphin sightings and by
number of dolphins were 3.44 and 13.44 respectively. No exceedance of the
encounter rates for action and limit levels were recorded during the
construction phase. Average annual abundance of CWD in Hong Kong western waters
was estimated at 60 individuals in 2016 from line-transect analysis. CWD
relative occurrence from land-based surveys around Lung Kwu
Chau peaked in spring, concurrent with the start of the wet season. Waters
around Lung Kwu Chau remain an important year-round
habitat for CWDs, especially for foraging. Passive acoustic monitoring showed
dolphins used the area around south of Sha Chau throughout the year, but with
increased activity during winter and spring months. The acoustic data
also showed consistently higher levels of dolphin clicking activity at night,
which may indicate increased using of echolocation by dolphins during hours of
darkness.
Ferry
movements between HKIA SkyPier and Zhuhai / Macau
were audited in the reporting period. In total, 10,043 ferry
movements between HKIA SkyPier and Zhuhai / Macau
were audited in the reporting period. The daily movements of all SkyPier HSFs in the reporting period ranged between 1 and
97, which falls within the maximum daily cap number of 125. There are
fewer ferry movements on 1st, 2nd August and 21st October due to typhoon. The annual daily
average of all SkyPier HSFs in 2016 was 90.86
movements, which falls within the annual daily average cap of 99 SkyPier HSF movements. Most of the HSFs had travelled
through the SCZ with average speeds below 15 knots, which complied with the SkyPier Plan. A few cases of average speed deviation were
due to public safety. All ferry movements that did not strictly follow the
diverted route have been investigated.
The
audit of construction and associate vessels has started since August 2016. ET
has conducted weekly audit to ensure the contractors have provided sufficient
information to the MTCC and the contractors fully complied with the
requirements of the MTRMP-CAV. A total of 24 skipper training workshops
were conducted by the ET from August to December 2016 with concerned captains
of construction vessels associated with 3RS
contracts. Another 18 skipper training workshops were conducted by
contractors’ EO and competency tests had been conducted subsequently with the
trained captains by ET.
On the implementation of Marine
Mammal Watching Plan, silt curtains were in place by the contractors for sand
blanket laying works and dolphin observers were deployed in accordance with the
Plan. On the implementation of Dolphin Exclusion Zone Plan, dolphin observers
were deployed by the contractors for continuous monitoring of the DEZ for DCM
trial works in accordance with the DEZ Plan. Trainings
for the dolphin observers on the implementation of MMWP and DEZ monitoring have
been provided by the ET prior to the aforementioned works. Testing on night
vision devices for Dolphin Exclusion Zone monitoring was also conducted before
the DCM trials. From the contractors’ MMWP observation records and DEZ
monitoring records, no dolphin or other marine
mammals were observed within or around the DEZ and silt curtains during the
reporting period. Audits of acoustic decoupling for construction vessels
were also carried out by the ET.
Overall, the recommended
environmental mitigation measures, as included in the EM&A programme, have
been effectively implemented during the reporting period. Also, the EM&A
programme implemented by the ET has effectively monitored the construction
activities and ensure the proper implementation of mitigation measures.